

Simon Burgess (University of Bristol)
Ellen Greaves (University of Bristol)
Richard Murphy (University of Texas at Austin)
Teacher recruitment and retention are at the forefront of education policy discussion at the moment. The pay of teachers is often cited as a problem, and possibly part of a solution. Clearly the level of pay is an issue, with the continuing overall pay cap implying real terms pay cuts for many teachers. But another part of the picture is the procedures which decide how much an individual teacher gets paid, and until recently this has been the pervasive public-sector approach of pay increasing (slowly) with time in post. What if we changed that and made the profession more attractive to high performers?
We have just investigated a very significant attempt to do precisely that.
Back in 2013 the Coalition Government introduced one of the most wide-ranging reforms to teachers’ pay setting in many years. The most striking element was the requirement for all Local Authority (LA) maintained schools to introduce Performance-Related Pay (PRP) for all teachers. Part of the Government’s thinking behind this was indeed to attract more high performers to the profession. Of course, PRP can have other effects on pay and performance, potentially positive or potentially negative. Note that this was a requirement for schools, not an opportunity: schools were forced to tie the pay of their teachers to performance. Furthermore, that command deliberately came without a centrally mandated set-up (some very general advice only). Schools were explicitly left to design their own pay schemes and choose their own performance measures, though many adopted union or LA recommended templates. The other main element of the reform removed the requirement for ‘pay portability’ which had guaranteed teachers at least the same pay in an equivalent new job as the old. This meant that teachers quitting one job for another could now in principle be paid less in the new one.
Our new report provides the first in-depth analysis of the impact of this major reform. We have focussed on what has to be the first question – the impact of the reform on pay. Quantifying any effect on pupil attainment will come later.
In this blog we report on our work using the School Workforce Census (SWC) to directly quantify the impact on pay. The bulk of the report sets out the findings from consultations with teachers (900 Headteachers and 1020 teachers) carried out by the National Foundation for Educational Research (NFER). These explored teachers’ views on implementation of the reforms (the degree of implementation, the performance management system, perceived fairness and so on). The research was commissioned by the Department for Education (DfE), and they have published the research.
Clearly it is the level of pay that matters most to many of the players in this market, not least teachers themselves, and that is discussed in the report, but it is not our primary focus in this blog.
Our concern is with the early effects of this major deregulation of the teacher labour market.
What would you expect to see? We know teachers’ performance differs dramatically, and so any reasonable measure of performance coupled with even a moderately-geared incentive scheme should yield substantially higher variation in pay.
However, the data show that while there is greater variation in pay, the increase is small. This graph shows the variation in base pay for teachers for a time period before the reforms (November 2012) and a time period after the reforms (November 2015).
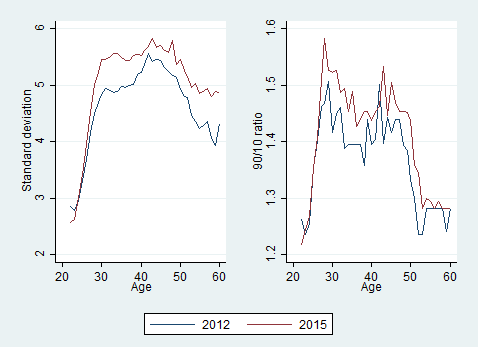
The left-hand panel uses the standard deviation as a measure of variation, and the right hand panel shows a measure that is less sensitive to outliers in pay. Happily, they both tell the same story. A very similar pattern is also evident for the pay of school leaders (see Figure 4 on page 40 of the report). This small increase in variability is present across both main phases of education, all school types and all the teacher characteristics we had, including whether they were teaching a shortage or non-shortage subject. We emphasise that this is the straightforward ‘raw’ variation, we have not taken account of teacher characteristics and changes in the composition of the teacher workforce over these years. However, the fact that the small increases in variation appear to be common suggests that a conditional analysis would show the same thing. A final finding is that the increases in within-school and between-school variation are about the same. This is consistent with schools implementing different PRP policies, with differences in the scope to differentiate pay.
The first place we might see some signs of change is in the distribution of annual pay changes for teachers. Again the story is of some slow change. First, many schools continued to award annual pay increases that closely mimicked the old spine points. For them, the requirement to differentiate pay by performance does not appear to be something they wanted to embrace, and it seems that they simply did the least they could to comply with the directive. Nevertheless, there is a significant decrease in schools paying the modal pay rises.
Percentage of teachers on the main pay range but below the top of the pay range whose annual change in nominal pay (full-time equivalent base pay) is in one of three modal groups.
| 2010-2011 | 2011- 2012 | 2012- 2013 | 2013- 2014 | 2014- 2015 |
| 75.1 | 76.1 | 67.6 | 49.3 | 39.8 |
(for details, see Table 8 in the report.
In summary, after two years of a mandatory policy to base pay on performance rather than tenure, some schools are starting gingerly to use their new freedoms. Not all schools, and those that do, not by much. Since the impact on pay and incentives has been minimal, we would expect little early impact on recruitment and retention.
How can this be? In the survey, 99% of Headteachers from LA maintained schools reported that they had implemented the reforms (as they were required to do). What this suggests is that for many schools that implementation was largely symbolic. Actual pay awards varied little and supposed links to performance were minimal. Given that no performance management system was imposed on schools, they were clearly free to pick metrics that did not discriminate much between the performance of different teachers.
One key question is: why did so many schools decide that introducing stronger PRP would be unwise? Perhaps it’s not so unexpected: economic theory suggests a number of reasons why a straightforward private sector logic for PRP might not translate into the public sector and teachers in particular. These reasons include hard-to-measure productivity, outputs produced by teams of people (for example, the Maths Department), the risk of dysfunctional outcomes (for example, so-called ‘teaching to the test’), as well as a concern about union and teacher dislike of PRP. Finally, PRP was introduced at a time when many schools were facing a tight financial situation, limiting scope for increasing teacher pay. Would it have been different if it had been introduced in a time of growing school budgets?
It’s too early to see how the system might evolve. As with any major change, meaningful implementation is likely to be slow, even for something schools are required to do! The early indications of a move away from spine points may continue and the shadow spine points might gradually disappear.
Of course, the true test of the policy will be whether there is an impact on pupil attainment from the incentives. We plan to look at this in the near future. While the international evidence is split, there is certainly reason to think it might appear. But the key point is this: a lot of evidence shows that people respond very precisely to what they are incentivised to do. The exact performance metrics that schools have chosen are therefore key to the success of this policy and are largely unknown: design is key. The quixotic decision to allow schools to pick their own may yet come back to haunt the government.